Mapping Phobos surface heterogeneity and the landing site selection
During the "Phobos-Grunt" s/c landing on the Phobos its surface heterogeneity is mapped using images obtained by the wide-angle TV camera (ShTK) included in the TV system for navigation and observation. The map is transmitted to the onboard computer where suitability of the landing site predicted by current trajectory measurements may be determined. In case of its unfitness a decision is made to retarget the spacecraft on the most level site of a given size in the ShTK field of view.Map of heterogeneity is generated based on the relative variance of image brightness with additional consideration of shading and proximity to major irregularities. To this end, images are processed in a moving window, whose size corresponds to the desired size of the landing site (10 m) and is adjusted during s/c descent. To better define optimal landing site analysis is performed with overlapping windows, which increases with s/c descent. At low altitudes, additional coarsening of images is made in order to avoid the influence of the regolith texture on the images' contrast.
Onboard software that implements the algorithm, is written in C language. Time of heterogeneity mapping of on the ShTK processor ADSP-21 060 with clock frequency of 24 MHz is about 0.1 sec. Heterogeneity map is transferred to onboard computer, along with reportage frame and the results of measurements of height and lateral movement once every 6 seconds.
The algorithm was tested using real high resolution images of Phobos, the Moon and Mars, as well as simulated images of rough surfaces. To illustrate the figure shows the heterogeneity map generation using image of Phobos covering the hypothetical landing site obtained from Mars-Express s/c. The resulting map of the surface heterogeneity adequately reflects the dangerous i and allows to choose the optimum landing site.
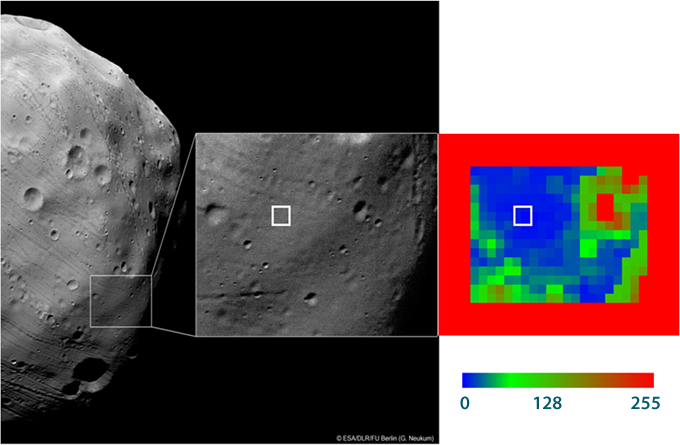
The original image of Phobos (left) has a resolution of 4.4 meters
Its enlarged fragment (center) corresponds to the pre-selected landing area(Courtesy ESA/DLR/FU Berlin, G. Neukum).
The heterogeneity map (right) built for the area is color-coded so that with increase in surface heterogeneity map's color changes from blue to red.
Optimal landing site is marked with white square.